Urban Tree Canopy in Greenville, North Carolina
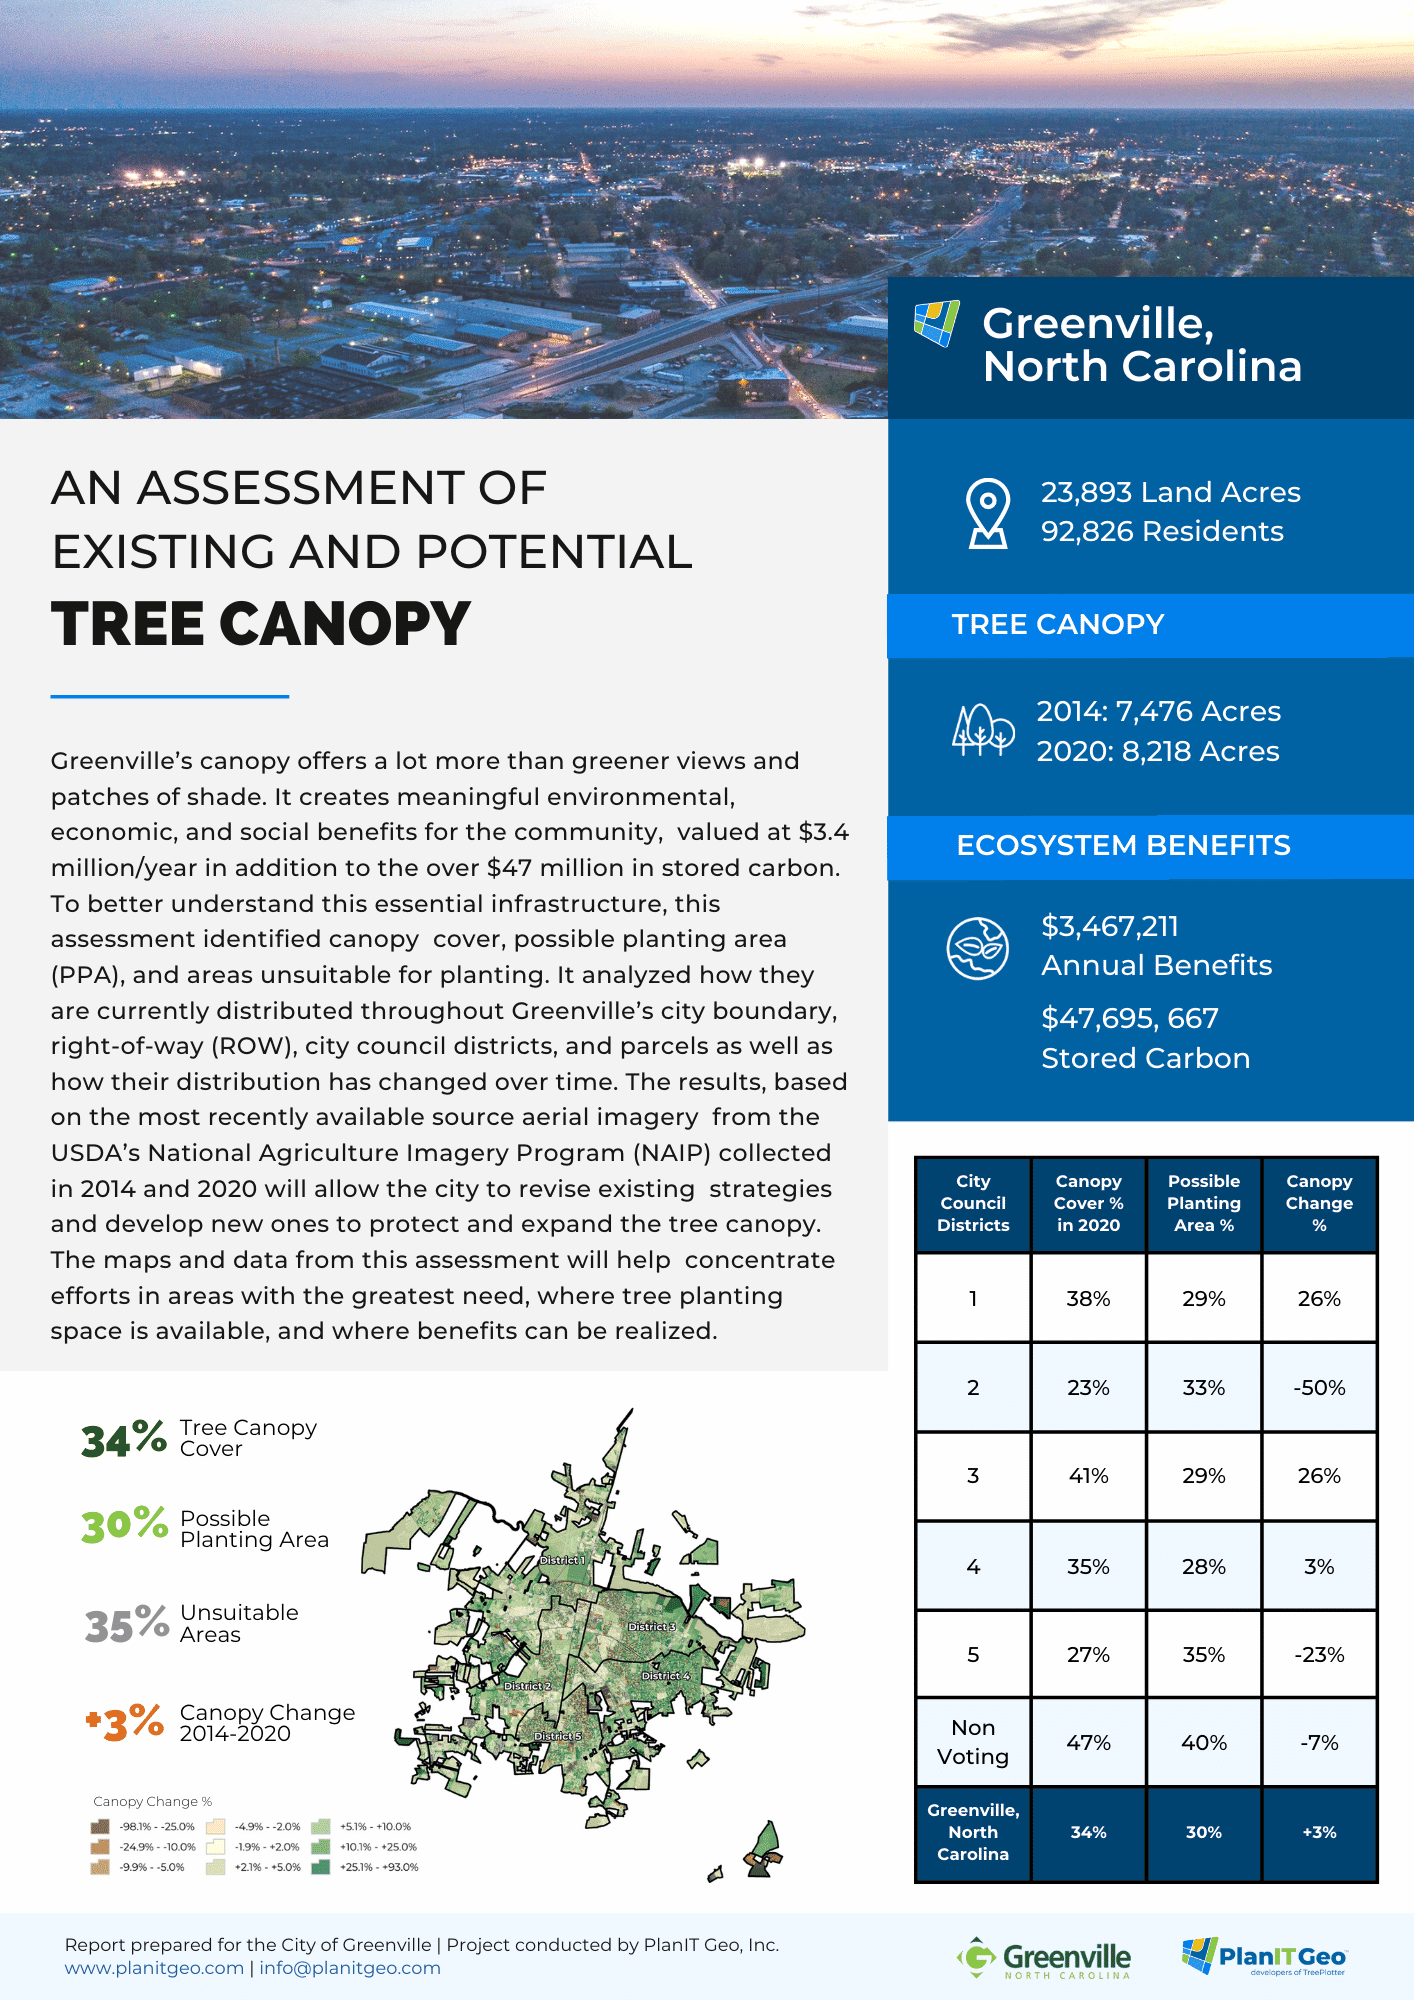
Greenville’s canopy offers a lot more than greener views and patches of shade. It creates meaningful environmental, economic, and social benefits for the community, valued at $3.4 million/year in addition to the over $47 million in stored carbon. To better understand this essential infrastructure, this assessment identified canopy cover, possible planting area (PPA), and areas unsuitable for planting. It analyzed how they are currently distributed throughout Greenville’s city boundary, right-of-way (ROW), city council districts, and parcels as well as how their distribution has changed over time. The results, based on the most recently available source aerial imagery from the USDA’s National Agriculture Imagery Program (NAIP) collected in 2014 and 2020 will allow the city to revise existing strategies and develop new ones to protect and expand the tree canopy. The maps and data from this assessment will help concentrate efforts in areas with the greatest need, where tree planting space is available, and where benefits can be realized.
Trees are green infrastructure that, with proper care, appreciates in value over time. A land cover map was created from 2020 aerial imagery to capture all of Greenville’s tree canopy cover, and values from i-Tree were used to quantify the benefits that those trees provide. In 2020, tree canopy constituted 34% of citywide land cover; noncanopy vegetation was 33%; soil/dry vegetation was 2%; impervious was 30%; and water was 2%. The city’s 8,218 acres of tree canopy were further divided into subcategories based on whether the canopy was shading pervious or impervious surfaces. Tree canopy shading an impervious surface can provide many benefits through ecosystem services such as localized cooling provided by shading and increased stormwater absorption. Greenville’s canopy was predominantly shading pervious surfaces at 97%, while 3% was shading impervious surfaces
Next, tree canopy data were analyzed for several geographies, including city council districts and parcel boundaries, to see how the distribution of canopy cover compared at different scales. In 2020, City Council District 1 contained approximately 7,609 land acres, 38% canopy cover or 35% of the citywide canopy, and 29% PPA (30% of all PPA citywide). In 2014, the same area contained 11% canopy cover indicating a ~26% gain (2,014 acres) in the canopy over the six years. City Council District 2 experienced the highest canopy loss at -50% (1,826 acres). Greenville has 32,045 individual parcels in which 31% of parcels met or exceeded the citywide average of 34%, and 21% had a canopy cover of 50% or greater. Within Greenville’s parcels, 443 parcels were entirely covered by canopy while 12,100 parcels contained no canopy at all. The City should focus on community outreach and education programs to better inform citizens of the environmental, health, social, and financial benefits that trees provide to help grow the tree canopy in the 7,200+ acres of plantable space and protect the existing canopy.
Key Insights
Land Acres
% canopy cover in right-of-way
% of Greenville is plantable Space
Ecosystem Benefit Values
- $3,467,211 Annual Benefits
(air quality, stormwater, and carbon sequestration) - $51,162,879 Total Benefits
(total annual benefits plus stored carbon) - $312,294 Stormwater Reduction
(34 million gallons of runoff prevented annually) - $1,232,692 Air Quality
(648,989 lbs. of pollution removed annually) - $1,922,224 Carbon Sequestration
(11,270 tons of carbon sequestered annually) - $47,695,667 Carbon Storage
(279,656 tons of carbon stored in the canopy)

