Urban Tree Canopy Assessment: Project Summary
Yakima, WashingtonUrban Tree Canopy in Yakima
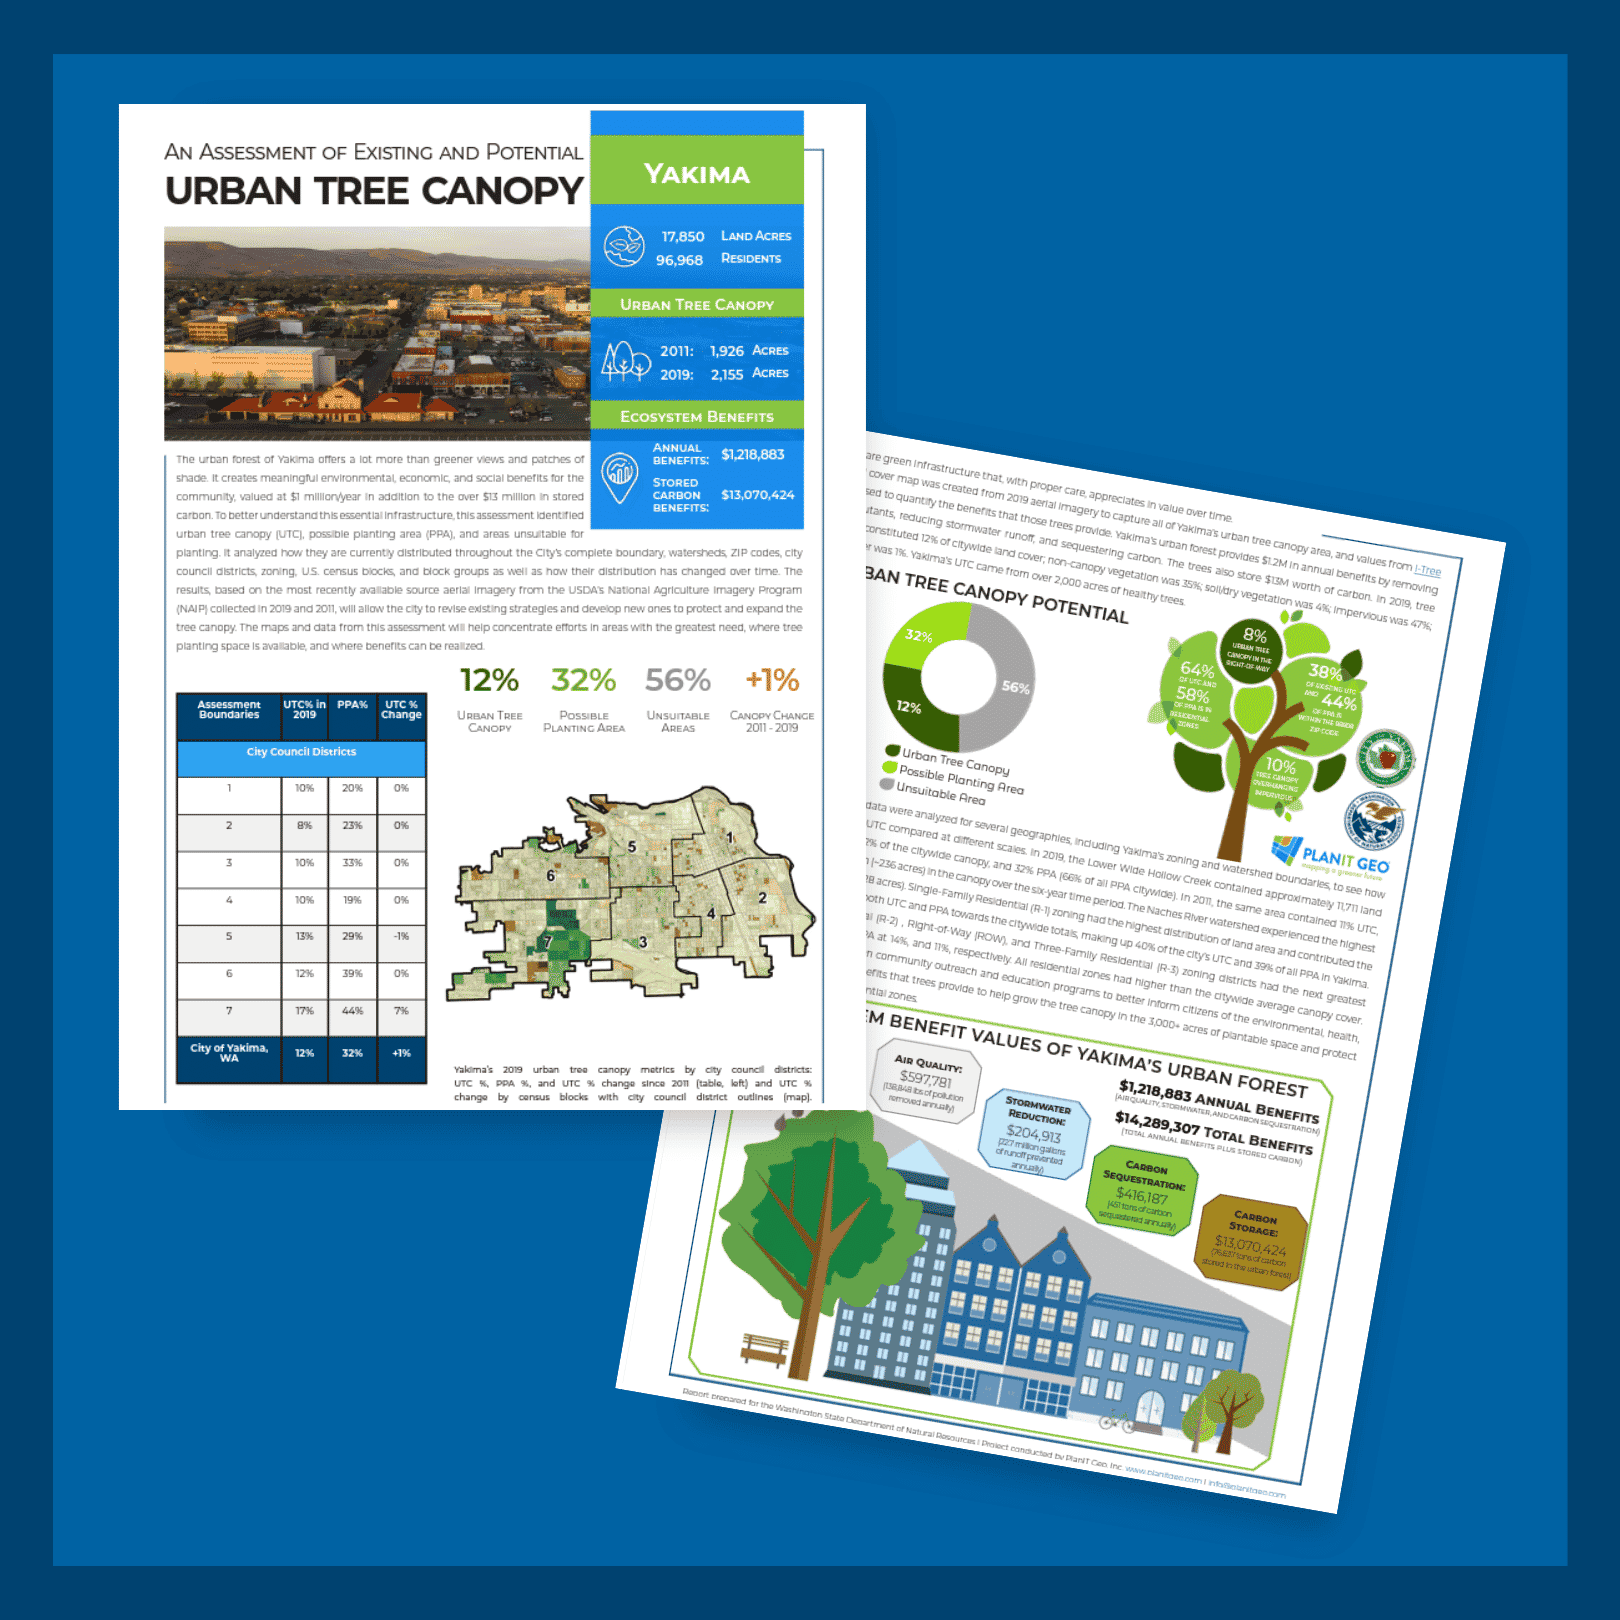
The urban forest of Yakima offers a lot more than greener views and patches of shade. It creates meaningful environmental, economic, and social benefits for the community, valued at $1 million/year in addition to the over $13 million in stored carbon. To better understand this essential infrastructure, this assessment identified urban tree canopy (UTC), possible planting area (PPA), and areas unsuitable for planting. It analyzed how they are currently distributed throughout the City’s complete boundary, watersheds, ZIP codes, city council districts, zoning, U.S. census blocks, and block groups as well as how their distribution has changed over time. The results, based on the most recently available source aerial imagery from the USDA’s National Agriculture Imagery Program (NAIP) collected in 2019 and 2011, will allow the city to revise existing strategies and develop new ones to protect and expand the tree canopy. The maps and data from this assessment will help concentrate efforts in areas with the greatest need, where tree planting space is available, and where benefits can be realized.
Trees are Infrastructure
Trees are green infrastructure that, with proper care, appreciates in value over time. A land cover map was created from 2019 aerial imagery to capture all of Yakima’s urban tree canopy area, and values from i-Tree were used to quantify the benefits that those trees provide. Yakima’s urban forest provides $1.2M in annual benefits by removing air pollutants, reducing stormwater runoff, and sequestering carbon. The trees also store $13M worth of carbon. In 2019, tree canopy constituted 12% of citywide land cover; non-canopy vegetation was 35%; soil/dry vegetation was 4%; impervious was 47%; and water was 1%. Yakima’s UTC came from over 2,000 acres of healthy trees.
Gains and Losses
Next, tree canopy data were analyzed for several geographies, including Yakima’s zoning and watershed boundaries, to see how the distribution of UTC compared at different scales. In 2019, the Lower Wide Hollow Creek contained approximately 11,711 land acres, 13% UTC or 72% of the citywide canopy, and 32% PPA (66% of all PPA citywide). In 2011, the same area contained 11% UTC, indicating a ~2% gain (~236 acres) in the canopy over the six-year time period. The Naches River watershed experienced the highest canopy loss at -4% (~28 acres). Single-Family Residential (R-1) zoning had the highest distribution of land area and contributed the greatest amounts of both UTC and PPA towards the citywide totals, making up 40% of the city’s UTC and 39% of all PPA in Yakima. Two-Family Residential (R-2) , Right-of-Way (ROW), and Three-Family Residential (R-3) zoning districts had the next greatest amount of citywide PPA at 14%, and 11%, respectively. All residential zones had higher than the citywide average canopy cover. The City should focus on community outreach and education programs to better inform citizens of the environmental, health, social, and financial benefits that trees provide to help grow the tree canopy in the 3,000+ acres of plantable space and protect existing canopy in residential zones.
Key Insights
Annual Ecosystem benefits
Urban Tree Canopy
Canopy Change 2011-2019

