URBAN TREE CANOPY ASSESSMENT
Washington DC, USAPURPOSE OF THIS URBAN TREE CANOPY ASSESSMENT
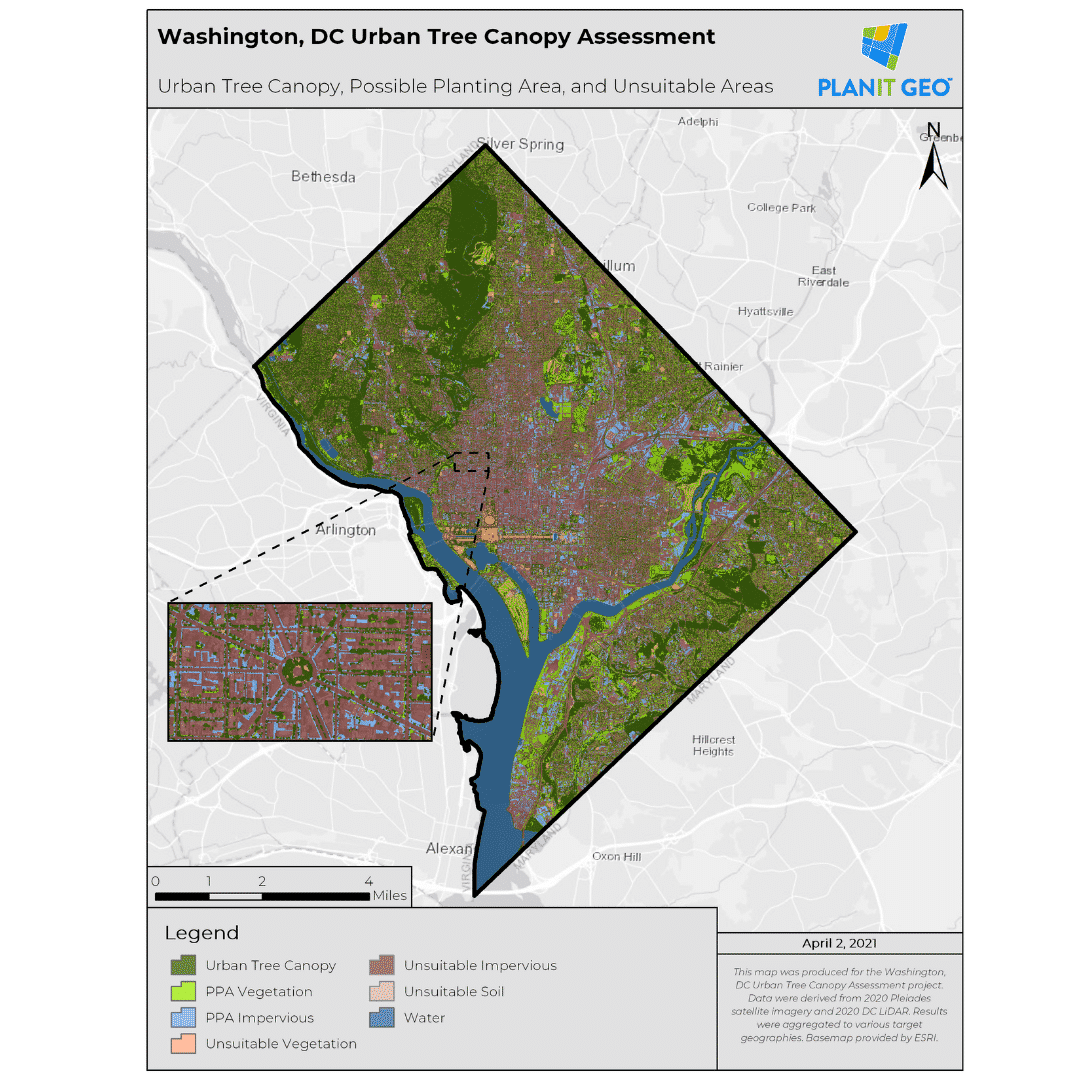
The City of Washington, D.C. (Figure 1) is approximately 68 square miles or 43,853 acres. Across the city, trees along streets, in parks, yards, and natural areas constitute a valuable urban and community forest. This resource is a critical element of the region’s green infrastructure, contributing to environmental quality, public health, water supply, local economies, and aesthetics. The primary goal of this assessment was to provide an updated benchmark of the City’s tree canopy and interpret the result across a range of geographic boundaries. Additionally, this assessment aims to continue monitoring efforts to maintain, expand, and ensure the equitable distribution of tree canopy.
URBAN TREE CANOPY IN WASHINGTON DC
In 2020, Washington, D.C had 37% urban tree canopy (UTC) cover and 24% possible planting area (PPA), not including any surface water bodies within the district boundary. The City’s total land cover including surface water bodies contained 33% tree canopy, 15% non-canopy vegetation; <1% soil/dry vegetation; 41% impervious surfaces, and 10% water. Urban tree canopy assessments routinely exclude surface water bodies when reporting tree canopy and plantable space percentages. In further dividing the City’s urban tree canopy, 19% was overhanging impervious surfaces, and 81% of all canopy was overhanging pervious surfaces. This project is the continuation of tree canopy assessments beginning in 2006. Previous assessments provide a view into the changing nature of tree canopy, the impacts of development and management strategies. Washington D.C. gained 1% (425 acres) urban tree canopy since 2006, saw a neutral change since 2011, and lost 1% (565 acres) since 2015.
Access the Urban Tree Canopy Assessment
ASSESSMENT BOUNDARIES
This study assessed UTC and PPA at multiple geographic scales in order to provide actionable information to a diverse range of audiences. By identifying what resources and opportunities exist at these scales, the City can be more proactive in their approach to protect and expand their urban tree canopy. Land cover metrics were generated at the following geographies: the citywide boundary (1); right-of-way (4); wards (8); land use (11); advisory neighborhood commissions (40); single member districts (296); census block groups (571); census blocks (6,012); and common ownership lots (137,200).
RECOMMENDATIONS
The results of this analysis can be used to develop a continuing strategy to protect and expand the urban forest in Washington, D.C. The UTC and PPA metrics along with the Urban Forestry Program Review completed as part of this study, can be used as a guide to determine where the city has been successful in protecting and expanding its urban forest resource, while also targeting areas to concentrate future efforts based on needs, benefits, and available planting space. Washington, D.C. can use these results to ensure that their urban forest policies and management practices continue to prioritize its maintenance, health, and growth.
Fill out the form to access the full Urban Tree Canopy Assessment

Access the Urban Tree Canopy Assessment
Urban Tree Canopy Assessment Insights
37%
Urban Tree Canopy
24%
Possible Planting Area
41%
Impervious Surface
