Green Metrics: NatureScore™ and Tree Equity Score
How Do Two of the Top Nature and Equity Metrics Measure Up
June 23, 2022 | Alec Sabatini
Urban forestry is increasingly benefiting from the insights of big data. This has been particularly helpful for measuring and communicating the value of trees and green space to governments and the public.
The foundational suite of i-Tree tools has now been joined by a host of other advanced green metrics that provide new perspectives on where green space is, what it offers, and where it is most lacking.
We have incorporated two of these metrics, NatureScore and Tree Equity Score, into our TreePlotter™ CANOPY software. Moving forward, new CANOPY applications will only include NatureScore™, though any existing application will continue to host Tree Equity Score. Read on for a detailed look at what each metric provides and how they compare.
NatureScore™
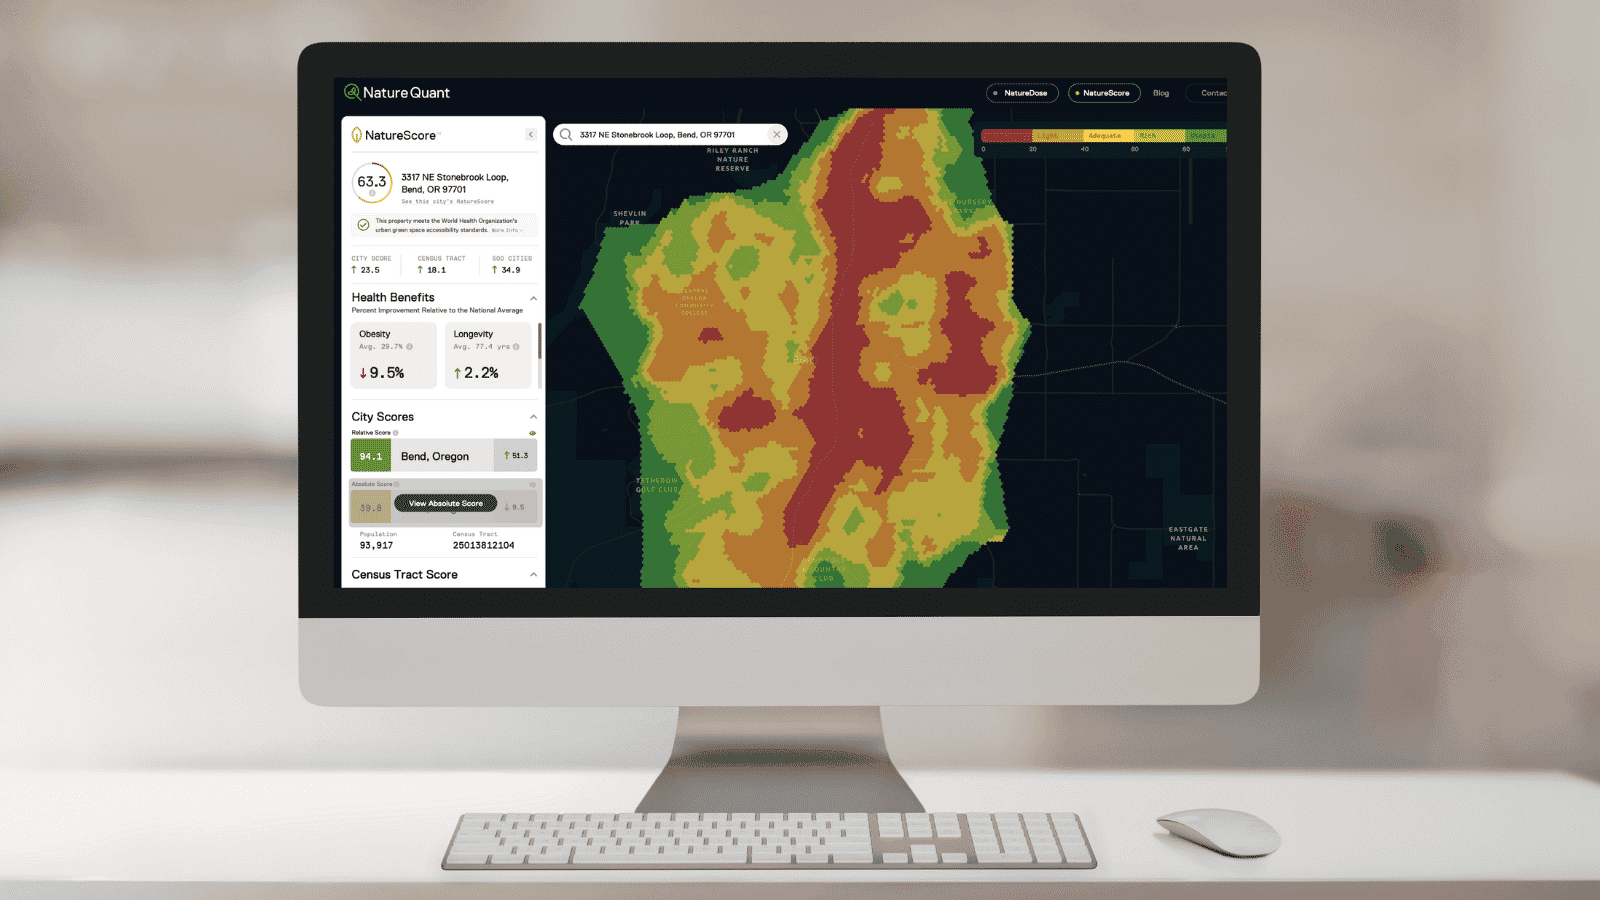
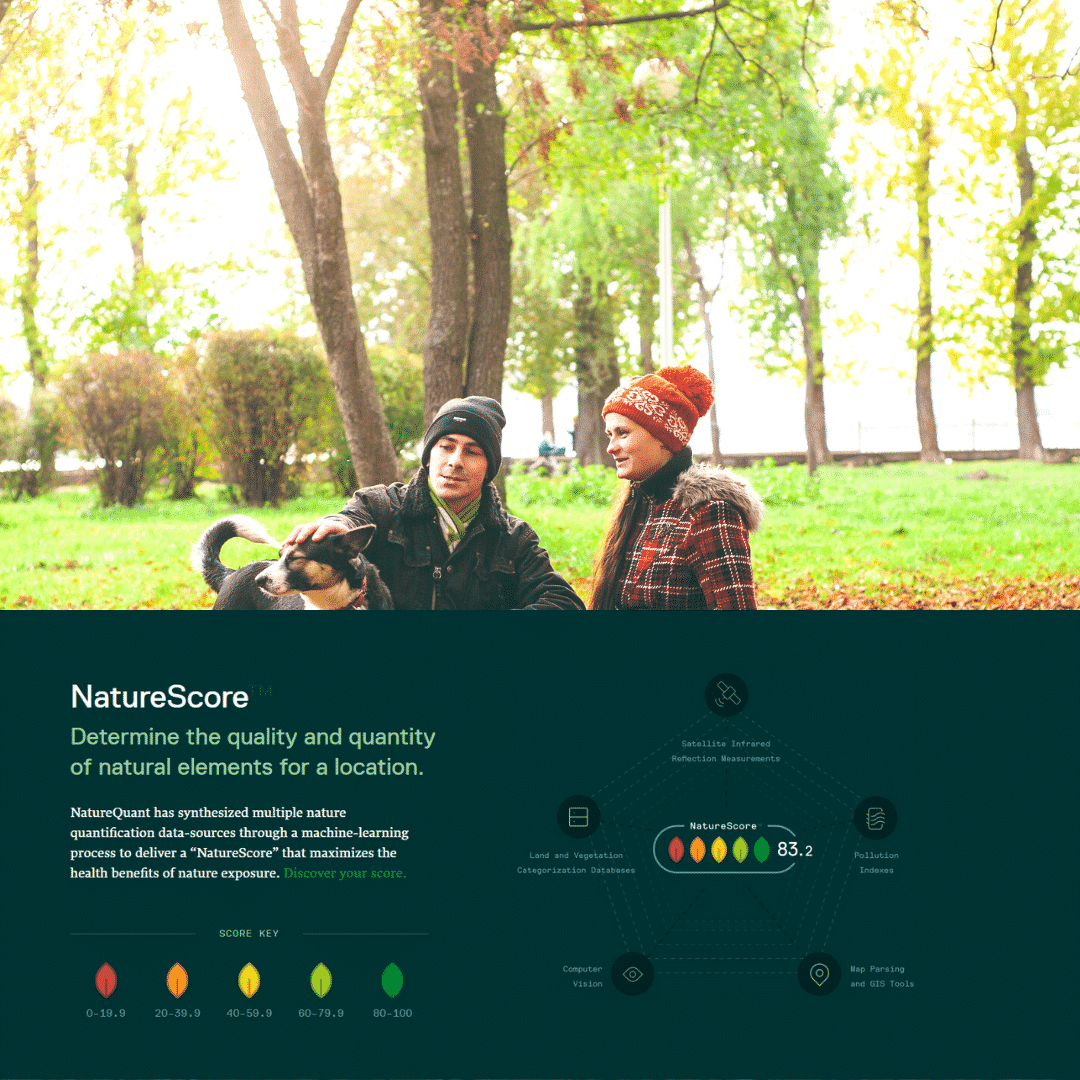
NatureScore is a metric from PlanIT Geo™ partner, NatureQuant. NatureQuant was formed to create a suite of technologies that enhance the health impact of nature on humanity. NatureScore advances this mission by condensing the complex impacts of nature on public health into a single, actionable number based on location.
The NatureScore map identifies not just where nature exists, but where quality nature leading to improved health outcomes exists, and where it is deficient. In short, living in an area with a high NatureScore is strongly associated with enjoying a longer, healthier life.
How it Works
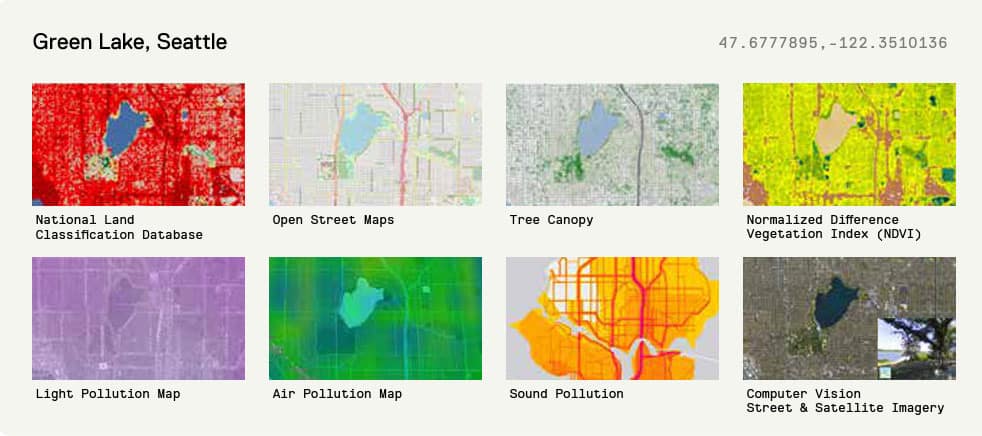
It starts with identifying where nature exists. For NatureScore this involves an aggregation of 30 different data sources to locate both green space (urban parks, public open spaces, street trees, landscaped plant life) and blue space (rivers, lakes, canals, waterfalls, and even some human-made water features). These data sources include computer vision processes for analyzing aerial and street-level imagery, vegetation databases, and other various GIS databases. NatureScore also factors in built environmental pollutions, like air quality, noise pollution, urban heat islands, and light pollution. As the component data sources are updated, so is NatureScore, that way the scores represent the most topical information available.
The geolocated nature elements are then processed by machine learning algorithms to produce a 0 – 100 score and are further sorted into quintiles of color-coded “leafs” representing the health impacts of nature for a certain radius around a location. NatureQuant applied the NatureScore process to national health data for over 30,000 census tracts and the top 500 cities, and found significant positive association between green space and increased longevity, and reductions in negative outcomes like cancer, diabetes, and cardiovascular disease.
NatureScore Priority Index
One of the best ways to improve the distribution of green space within communities is to spotlight areas for researchers, nonprofits, municipalities, and others that will most benefit from increased nature. To support that work, there is an additional metric called the NatureScore Priority Index (NPI). The NPI is calculated by combining the NatureScore with the Area Deprivation Index (ADI), which was created by the Health Resources & Services Administration (HRSA).
The ADI is calculated using 17 poverty, education, housing, and employment indicators drawn from US Census data. The 0-10 NPI rating identifies areas both nature deprived and with socioeconomic disadvantages. NPI is an actionable, interventional tool for governments and nonprofits to prioritize their efforts in disadvantaged communities.
Tree Equity Score
One of the biggest trends of urban forestry in the last five years is the rise of tree equity. If you’re involved in or around the urban forest industry, you’re likely already familiar. The phrase helped encapsulate and popularize a reality that forestry professionals and nonprofits have long been working against: the disproportionate distribution of tree canopy within our communities based on race and income.
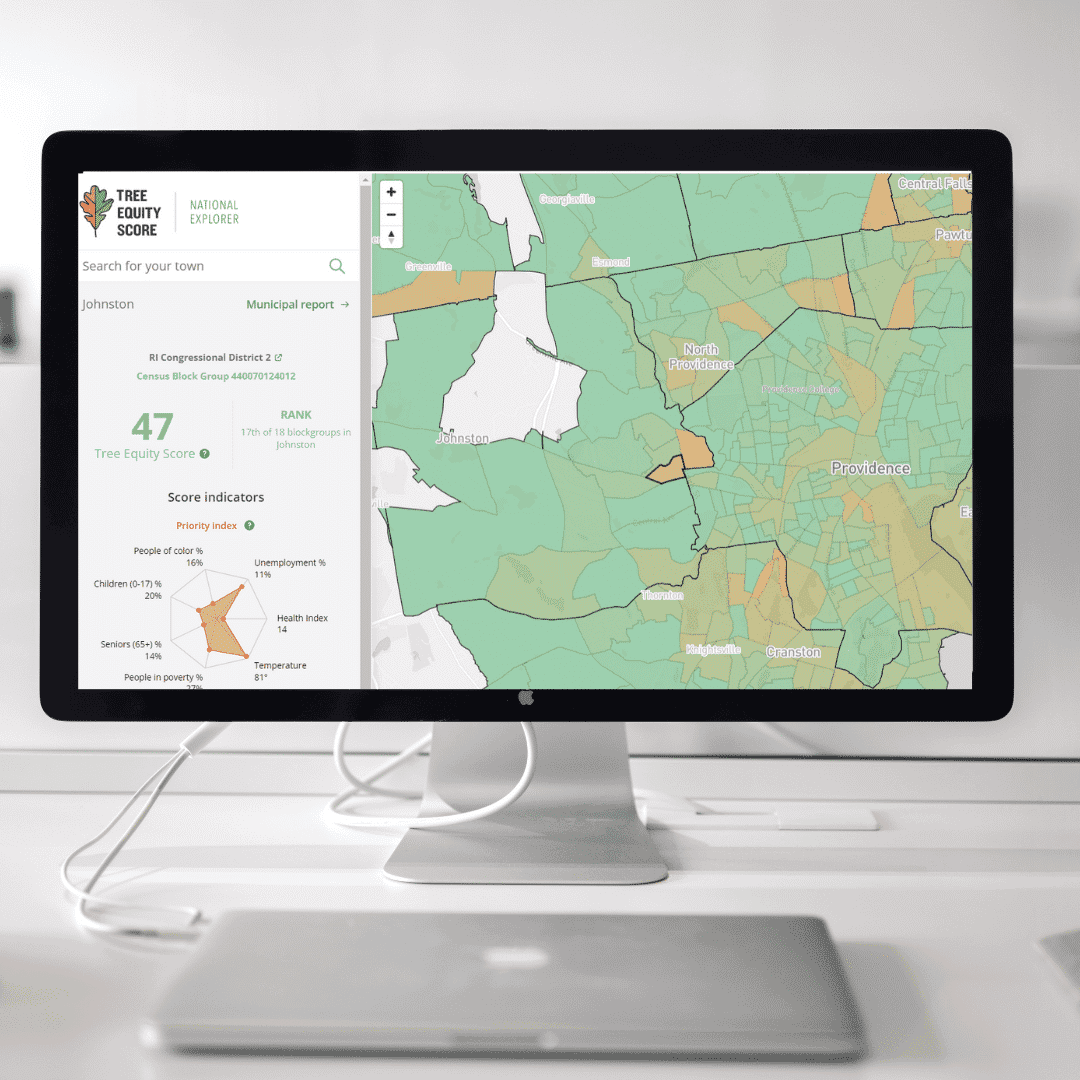
American Forests helped ignite this trend, thanks in large part to the launch of their Tree Equity Score. The Tree Equity Score (TES) is a metric to help cities assess how well they are delivering equitable tree canopy cover to all residents. The score combines measures of tree canopy cover needed in urban neighborhoods (defined as Census Block Groups). It is derived from tree canopy cover, climate, demographic and socioeconomic data. You can explore their interactive map to see how different cities and census block groups compare on the 0-100 Tree Equity Score.
How it Works
The Tree Equity Score is the summation of a four-step methodology. The steps are calculated at the neighborhood (census block group) level, and can then be aggregated for city and state scores. The first step is to determine an aspirational but achievable tree canopy goal for each neighborhood. A general biome target is used as the baseline (40% canopy for forest, 20% for grassland, and 15% for desert) and then adjusted for population density, so higher density areas have a proportionally lower canopy target.
The next step is to determine the tree canopy gap by subtracting the existing canopy from the determined canopy goal. Then the neighborhood’s priority index is determined by six equally weighted characteristics:
- Income: Percentage of population below 200% of the federal poverty threshold
- Employment: Unemployment rate
- Race: Percentage of people who are not white non-Hispanic
- Age: Ratio of seniors and children to working-age adults
- Climate: Urban Heat Island severity
- Health: Prevalence of poor mental, physical, respiratory, and cardiac health (composite index)
Finally, the 0-100 Tree Equity Score is determined by multiplying a neighborhood’s tree canopy gap score by the priority index. A lower TES equates to a greater priority to improve the tree canopy gap.
Distinguishing Between NatureScore and Tree Equity Score
Both of these tools offer valuable information, but there are some key points of difference. For example, Tree Equity Score is specific to tree canopy, while NatureScore includes a broader range of “natural elements”, such as lawns and bodies of water. TES is also limited to census blog groups while NatureScore can be calculated for any boundary or geography upon request.
Another technical differentiator between these two metrics, and the main reason PlanIT Geo will no longer include TES in new CANOPY applications, is TES is not available with 2020 census boundaries. TES was launched in 2019, and was based on the most recently available census boundaries at the time from 2010. NatureScore is available with 2020 census boundaries for all of the US, and the NatureScore Priority index is in the process of being updated to reflect those boundaries by the end of the year.
There is certainly overlap between the NatureScore Priority Index and Tree Equity Score, as both overlay socioeconomic factors with the prevalence of trees. If communities want to hone in on mapping the distribution of health-supporting nature, then that is purely the domain of NatureScore. That also means NatureScore can be used side-by-side with whatever unique datasets or measures a community may want to study.

Tree Equity Score is specific to tree canopy, while NatureScore includes a broader range of “natural elements”, such as lawns and bodies of water.
Turning Data Into Decisions
These metrics are fantastic tools, but they are also just building blocks for driving actual urban greening efforts. Our team of arborists and consultants are ready to help with the transition from information to action. We’re here to help design planting, management, and maintenance plans, provide advanced canopy assessment reports, and put arborists on the ground who can inventory and assess the condition of your current urban forest.
We can then fold these plans and associated objectives into our TreePlotter Software, so plans flow smoothly into action items and work orders can be easily tracked and updated.
We welcome a personalized discussion about how our software and services can support your trees.
Related Resources

This Is How You Measure The Impacts of Nature On Public Health
How can the well-documented health impacts of nature exposure be condensed into an actionable form? Let’s look at the process of NatureScore™, a tool from one of PlanIT Geo’s partners, NatureQuant.
Urban Forestry Guide for Governments
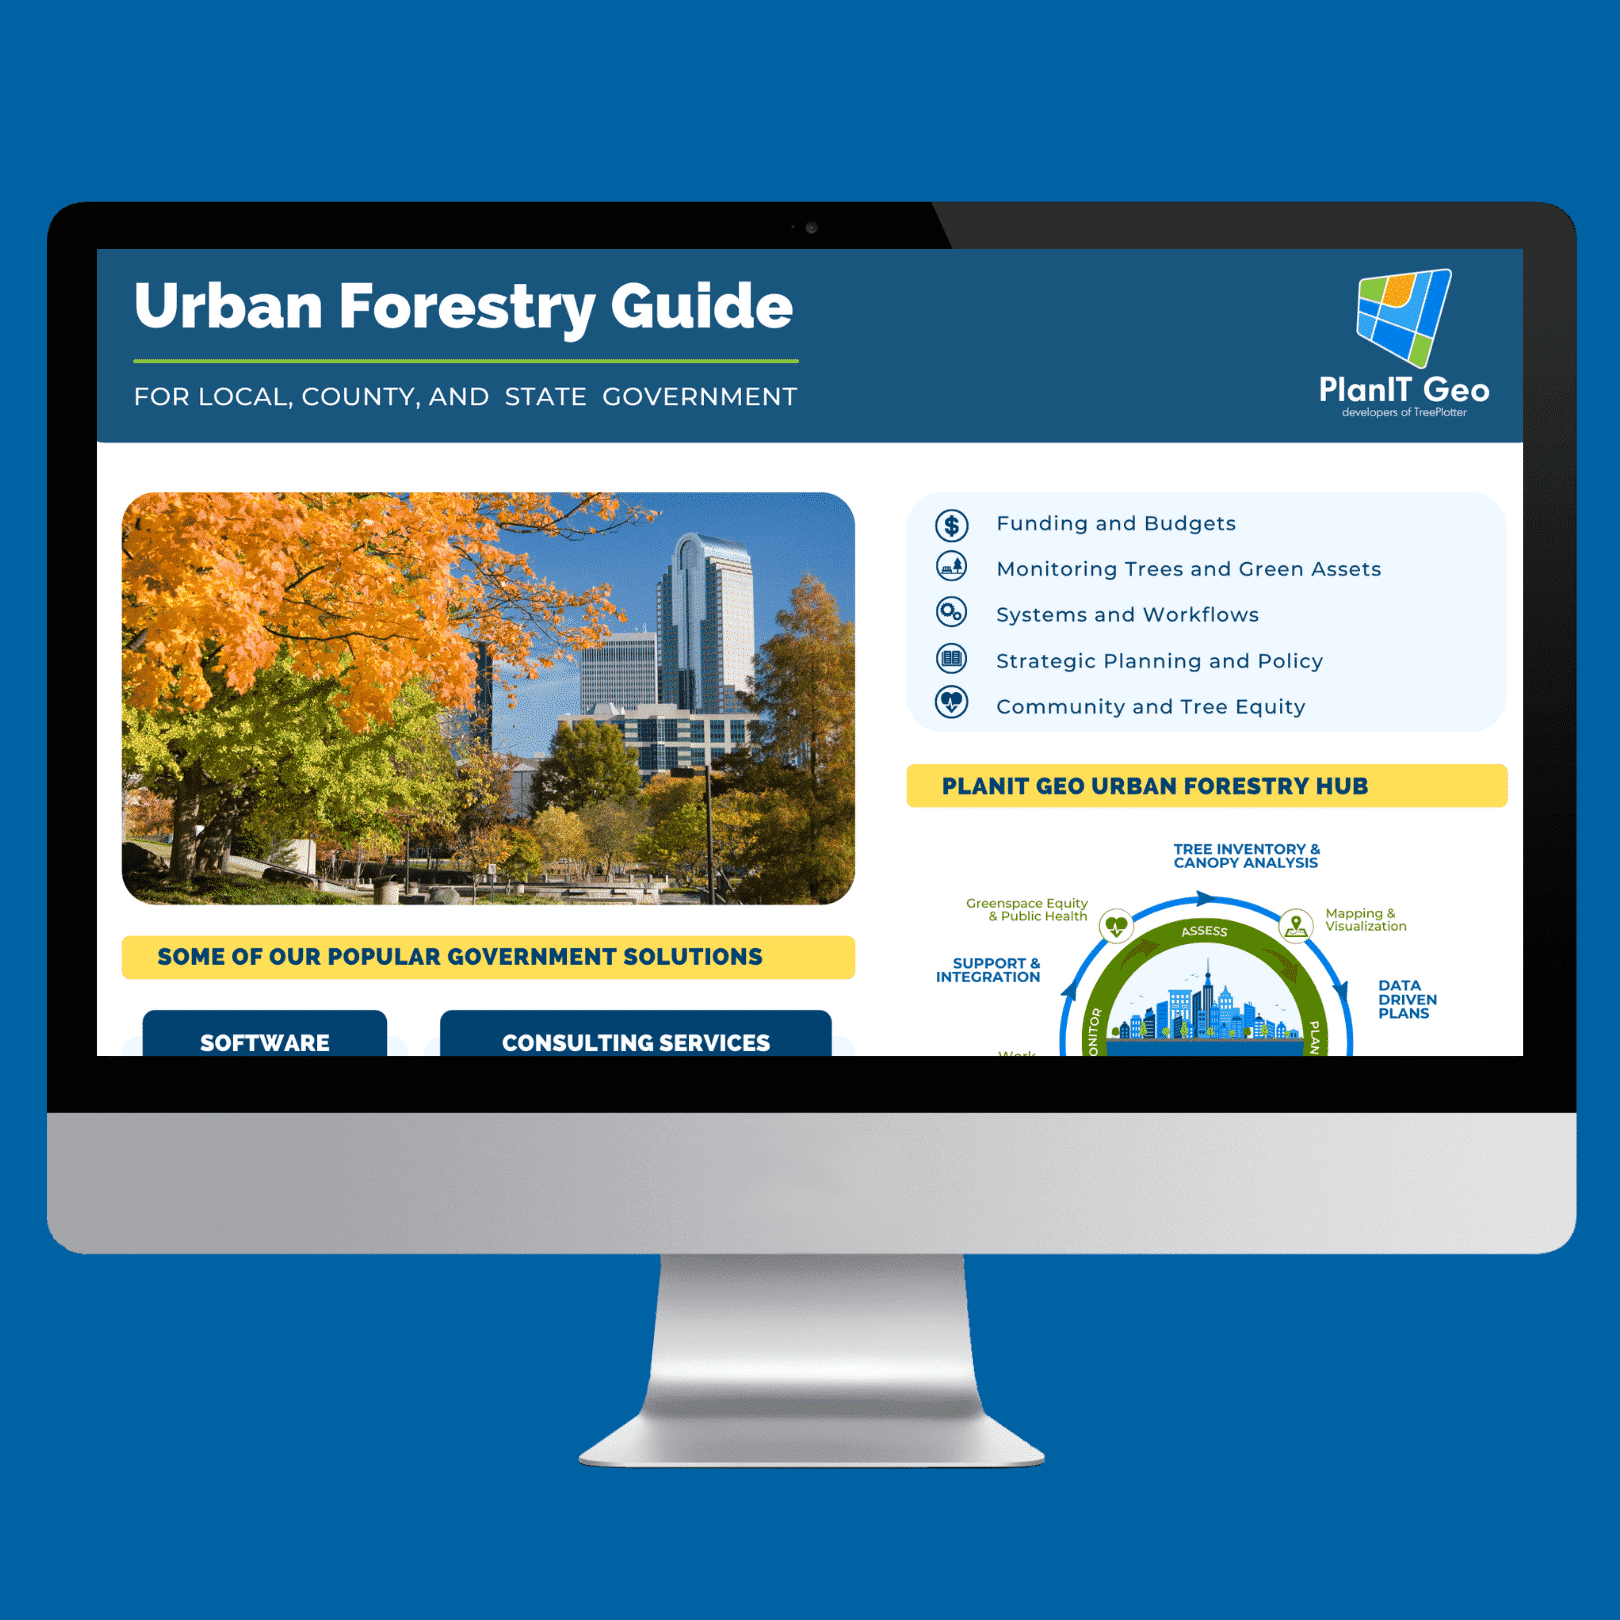
There is a lot that goes into running an effective urban forestry program. As a hub for urban forestry innovation, PlanIT Geo is able to provide support and guidance at any step in a program’s evolution. This guide lays out all of the solutions that we have used to help public urban forestry programs grow, improve, and adapt.

How to Communicate the Benefits of Trees to your Community
For those who work in urban forestry, the benefits of trees are a well-established fact. The general public however, tends to have a limited understanding of tree benefits, both in scope and depth. This guide outlines how to communicate the benfits of trees to yoru community.
Putting a Number on the Health Benefits of Nature
This webinar explores how NatureQuant is using innovative tech, machine learning, and big-data to quantify nature exposure and potential health benefits, the tools they’ve created to share this data, and how this information will be incorporated into PlanIT Geo’s software and services thanks to a new partnership.
Stay Up To Date With The Latest News and Events
Join Our Community
Stay informed on the urban forestry industry with our monthly TREEbune newsletter, live webinars, and industry-specific content delivered to your inbox.
Urban Forestry Webinars
PlanIT Geo has a substantial on-demand webinar library. Get CEU credits, grow your knowledge base, and stay current on cutting edge industry technology.
Follow Us
We love to share industry-related news, software tutorials, blogs, and company news across our social channels.
Stay Up To Date With The Latest News and Events
Join Our Newsletter
Stay informed on the urban forestry industry with our monthly TREEbune newsletter, live webinars, and industry-specific content delivered to your inbox.
Urban Forestry Webinars
PlanIT Geo has a substantial on-demand webinar library. Get CEU credits, grow your knowledge base, and stay current on cutting edge industry technology.
Follow Us
We love to share industry-related news, software tutorials, blogs, and company news across our social channels.

