
Urban Tree Canopy Assessments: What is an Urban Tree Canopy Assessment?

The PlanIT Geo™ Geospatial Mapping Services team is passionate about the importance of a quality urban tree canopy assessment.
In this blog series, learn more about the process, why you need one, and how an urban tree canopy assessment will benefit the community.
Part 3: What is an Urban Tree Canopy Assessment?
First developed by the U.S. Forest Service in 2006, the Urban Tree Canopy (UTC) Assessment was created to understand the amount and distribution of tree canopy in Baltimore, Maryland. Since then, UTC assessments have been performed in hundreds of cities throughout the United States as well as internationally.
By creating a map of tree canopy and other land cover types, communities can use this information to understand how much tree canopy there is, where it is located, and where new trees can be planted.
Additionally, cities can also use this information to inform other planning activities such as setting canopy cover goals, prioritizing where to plant new trees to address environmental and social issues, and developing urban forest management plans (UFMP).
PlanIT Geo was founded in 2012 in Arvada, Colorado. Many of our first projects were urban tree canopy assessments. We have extensive knowledge of best practices and how to provide the most useful products to meet each individual community’s needs.
Ways to perform an Urban Tree Canopy Assessment

Point Sampling
The most simple method is to use a point sampling technique developed by the i-Tree Canopy tool.
Random points, like those shown in the map, are generated within an area and manually assigned a value of “tree” or “non-tree” until a 1-2% standard error is reached. By dividing the number of “tree” points by the total number of points, you can quickly get an estimate of the percent canopy cover or any other land cover type. 1,500 points were classified to estimate 25% tree canopy cover in South Bend, Indiana.
The downside to this method is that there is no way to understand the location and distribution of tree canopy, plantable space, or other land cover types within various planning scales. Read more about how this method was used to measure canopy change in Colorado Springs, Colorado on page 28 of our report.

i-Tree Landscape
Another way to measure tree canopy is through the i-Tree Landscape tool. This tool uses land cover data from the National Land Cover Database. Once a location is selected, an estimate of the amount of tree canopy is provided. You can also explore location data (census data, forest risk, future climate, etc.), see tree benefits, prioritize tree plantings, and generate reports.
This is a great, free tool from i-Tree with lots of information to explore. However, the land cover data is typically lower resolution (30-meter) than what the third method provides (1-meter).
High-resolution land cover data are critical for understanding canopy cover in urban landscapes where much of the urban forest is comprised of street and park trees that are not visible with 30-meter pixels.

High-Resolution Land Cover Mapping
The third method uses remote sensing technology and high-resolution imagery (aerial or satellite) and elevation (LiDAR) datasets to create detailed land cover data. These data inform all other aspects of the project by categorizing a given landscape into specific classes such as tree canopy, other non-canopy vegetation, impervious or hardscape, bare soil, or water.
With this information in hand, you can then look at the quantity and geographic distribution of each type of land cover and ask many questions like:
- Where is there existing tree canopy? How much?
- How much gray infrastructure (roads, buildings, parking lots, etc.) is there compared to green infrastructure (trees, grass, other vegetation)?
- Where are there potential planting opportunities to increase canopy coverage and address specific issues?
Trees throughout the world face many threats, but trees in an urban environment are especially vulnerable.
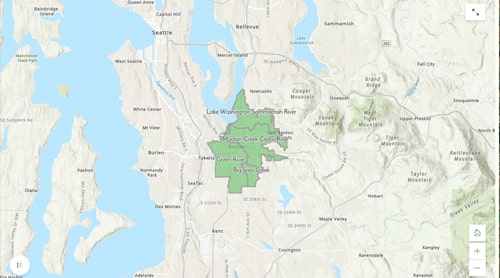
Geographic Assessment Scales
UTC assessments provide decision-makers with a top-down view of canopy cover throughout a city and across various spatial scales. These scales can benefit many city departments by providing detail on the current level of canopy cover, where plantable spaces exist, and where trees can be planted to address specific issues and to achieve a goal.
Stormwater staff may be interested in expanding canopy cover to help reduce runoff. Streets staff may be interested in increasing canopy cover within the public right-of-way to help offset urban heat islands. Council members may be interested in expanding canopy, green space, or recreation opportunities for their citizens.
Plantable Space and Planting Prioritization
Another key element of a UTC assessment is locating plantable or open space and identifying the most suitable areas for tree planting to address specific issues. Using a variety of tools and datasets, cities can determine the areas that would benefit the most for environmental, social, and economic reasons. The following series of maps from Jacksonville, Florida, show the most suitable areas (in blue) for each listed issue.


Air Quality
Identifying and planting in areas with high road density can help improve air quality for residents.

Energy Conservation
Residential areas with low amounts of tree canopy can benefit from tree plantings by helping to reduce energy costs through shade and wind blocking.

Underserved Populations
Tree canopy cover is often greater in areas with higher median income. Planting trees in lower-income communities can support environmental equity. This indicator shows the percentage of residents living below the poverty level.

Public Health and Asthma Rates
Trees help clean the air by absorbing dangerous pollutants. Planting trees in neighborhoods with high asthma rates can help improve living conditions in these communities. Public health data are only available at the census tract level, but notice how in Jacksonville these areas also generally coincide with income levels. This indicator shows the crude prevalence of current asthma among adults aged >=18 years.
Read parts 3 and 4 of this blog series to learn how an urban tree canopy assessment will help you understand and manage this critical resource.
Blog Series: Urban Tree Canopy Assessments
Part 1: Why Do Trees Matter?
Part 2: The Benefits of Trees
Part 3: What Is An Urban Tree Canopy Assessment?
Part 4: What Will I Get Out Of An Urban Tree Canopy Assessment?
View our interactive Urban Tree Canopy Assessments Story Map and learn how our Geospatial Mapping Services team can support your community forestry goals.
Related Resources

Blog
Part 4, Urban Tree Canopy Assessments Blog Series: What will I get out of an urban tree canopy assessment?

TreePlotter™ CANOPY Demonstration
Watch this on-demand webinar to learn more about AI-driven tree canopy analysis and how it is now incorporated into TreePlotter CANOPY software. Joined by EarthDefine, Ian Hanou, Founder and CEO of PlanIT Geo, will discuss what AI-driven tree canopy data is, how it can be used, and how you can benefit from utilizing it.

Everything You Need to Know About AI-Driven Tree Canopy Assessments
Mapping and analyzing your urban tree canopy data should be easy and affordable so you can spend more time on planning, management, operations, and community engagement tasks.
Make more time for what’s important by utilizing AI-driven tree canopy data to assess your urban forest. Here is how to get tree canopy data TOMORROW for under $2,600!

Washington D.C. Urban Tree Canopy Assessment
PlanIT Geo™ is an industry leader in urban tree canopy assessments, green infrastructure mapping, and web-mapping applications. We recently published the full Washington D.C. Urban Tree Canopy Assessment Report and it is available for instant download now.
Stay Up To Date With The Latest News and Events
Join Our Community
Stay informed on the urban forestry industry with our monthly TREEbune newsletter, live webinars, and industry-specific content delivered to your inbox.
Urban Forestry Webinars
PlanIT Geo has a substantial on-demand webinar library. Get CEU credits, grow your knowledge base, and stay current on cutting edge industry technology.
Follow Us
We love to share industry-related news, software tutorials, blogs, and company news across our social channels.
Join Our Newsletter
Stay informed on the urban forestry industry with our monthly TREEbune newsletter, live webinars, and industry-specific content delivered to your inbox.
Urban Forestry Webinars
PlanIT Geo has a substantial on-demand webinar library. Get CEU credits, grow your knowledge base, and stay current on cutting edge industry technology.
Follow Us
We love to share industry-related news, software tutorials, blogs, and company news across our social channels.